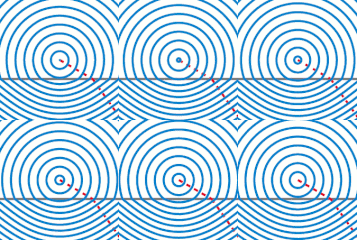
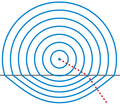
Snells_law_wavefronts.gif(225 × 227 picsel, dimension : 65 KByte, sort MIME: image/gif, a ripetizzion, 10 quader, 0,1 s)

Quell fail chì el ven de Wikimedia Commons e 'l po vesser doprad de alter proget. La descrizzion sora la soa pagina de descrizzion del fail l'è mostrada chì de sota.

Titel

Somari

 
Questo diagramma in GIF grafica è stato creato con MATLAB.
Descrizzion
English: Illustration of wavefronts in the context of Snell's law.
Data (UTC)
Sorgent Own work, created with MATLAB. (Source code below.)
Autor Oleg Alexandrov
Permess
(Doperà ancamò quell fail chì)
Public domain Mi, titolar del dirit d'autor per questa opera chì, la meti foeura in del domini publich. Questa norma chì la var in tut el mond.
In d'un quai paes chesschì el podarìss vesser minga permetud de la lensg. In del cas:
Mi sicuri a chissessia el dirit de drovà quell lavorà chì per qualsessia fin, sota nissuna condizzion, condamench ch'a ghe sìen di condizzion imposte de la lensg.
Alter version
Ghe xe na version vetoriale de sta imagine ("SVG").
Te pol dopararla al posto de sta imagine raster co che xe necessaria na risolussion superiore.

File:Snells law wavefronts.gif → File:Snells law wavefronts.svg

Par savérghene piassè su la grafica vetoriale lèzi: Commons:conversion a SVG.
Ghe xe anca informassion de suporto a le imagini SVG in MediaWiki.

In other languages ([//commons.wikimedia.org/w/index.php?title=Template:In_other_languages&action=edit translate this])
Alemannisch  Bahasa Indonesia  Bahasa Melayu  British English  català  čeština  dansk  Deutsch  eesti  English  español  Esperanto  euskara  français  Frysk  galego  hrvatski  Ido  italiano  lietuvių  magyar  Nederlands  norsk bokmål  norsk nynorsk  occitan  Plattdüütsch  polski  português  português do Brasil  română  Scots  sicilianu  slovenčina  slovenščina  suomi  svenska  Tiếng Việt  Türkçe  vèneto  Ελληνικά  беларуская (тарашкевіца)  български  македонски  нохчийн  русский  српски / srpski  татарча/tatarça  українська  ქართული  հայերեն  বাংলা  தமிழ்  മലയാളം  ไทย  한국어  日本語  简体中文  繁體中文  עברית  العربية  فارسی  +/−
Imagine SVG nova

Source code

% Illustration of Snell's law
function main()

   % indexes of refraction
   n1=1.0;
   n2=1.5;

   sign = -1;% is the source up or down?
   O=[0, -1*sign];
   k=500;

   
% KSmrq's colors
   red    = [0.867 0.06 0.14];
   blue   = [0, 129, 205]/256;
   green  = [0, 200,  70]/256;
   yellow = [254, 194,   0]/256;
   white = 0.99*[1, 1, 1];
   black = [0, 0, 0];
   gray = 0.5*white;

   color1=red;
   color2=blue;
   color3=gray;
   lw = 3;
   
   plot_line=0;
   Theta=linspace(0, 2*pi, k);
   V=0*Theta; W=0*Theta;
   S0=7;
   spacing=0.45;
   p=floor(S0/spacing);
   S=linspace(0, S0, p+1);
   spacing=S(2)-S(1);
   
   num_frames = 10;
   for frame_iter=1:num_frames

      figure(1); clf; hold on; axis equal; axis off;

      % plot the interface between diellectrics
      L=1.2*S0;
      plot([-L, L], [0, 0], 'color', color3, 'linewidth', lw);
      
      
      % plot a ray
      plot_line=1;
      s=L;
      theta=pi/3; wfr(s, theta, n1, n2, O, sign, plot_line, color1, lw);

      % plot the wafefronts
      plot_line=0;
      for i=1:p

	 s=S(i)+spacing*(frame_iter-1)/num_frames;

	 for j=1:k
	    theta=Theta(j);
	    [V(j), W(j)]=wfr(s, theta, n1, n2, O, sign, plot_line, color1, lw);
	 end
	 plot(V, W, 'color', color2, 'linewidth', lw);
      end
      

      %  dummy points to enlarge the bounding box
      plot(0, S0+2.5*spacing, '*', 'color', white);
      plot(0, -(S0+2.5*spacing)/n2, '*', 'color', white);

      % to know where to crop later
      Lx=3.2; Ly=Lx; shift = 1;
      plot([-Lx, Lx, Lx, -Lx -Lx], ...
           [-Ly, -Ly, Ly, Ly, -Ly]+shift);

      file = sprintf('Frame%d.eps', 1000+frame_iter);
      disp(file);
      saveas(gcf, file, 'psc2')
   end
end

% Converted to gif with the UNIX command
% convert -density 100 -antialias Frame10* Snell_animation.gif 
% then cropped in Gimp

function [a, b]=wfr(s, theta, n1, n2, O, sign, plot_line, color1, lw);

   X=O+s*[sin(theta), sign*cos(theta)];

  if( sign*X(2) > 0 )
    t=-sign*O(2)/cos(theta);
    X0=O+t*[sin(theta), sign*cos(theta)];
    
    if (plot_line == 1) 
      plot([O(1), X0(1)], [O(2), X0(2)], 'color', color1, 'linewidth', lw, 'linestyle', '--');
    end

    d = norm(O-X0);
    r = (s-d)*(n2/n1)^(sign);

    theta2=asin(n1*sin(theta)/n2);
    XE=X0+r*[sin(theta2), sign*cos(theta2)];
  else
    XE = X;
  end  
  a = XE(1);
  b = XE(2); 

  if (plot_line==1)
    plot([X0(1), XE(1)], [X0(2), XE(2)], 'color', color1, 'linewidth', lw, 'linestyle', '--');
  end  
end

Insegna

Sgionta una spiegazzion curta de cosa l'è che quell fail chì el rapresenta.
Wavefronts from a point source of light.In a particuler wavefront u will see that the dist btw source & wavefront above the line is > dist btw source & wavefront below the line beacuse lightspeed is greater in the above and lower in below.

Element rapresentad in quell fail chì

representa

Valor minga conossud senza un element Wikidata

Cronologia de l'archivi

Schiscia in su un grup data/ora per vedè l'archivi com 'a l'è che l'era in quell moment là

Data/OraMiniaduraGrandezzaUtentComent
corent11:59, 5 Lui 2009Miniadura de la version di 11:59, 5 Lui 2009225 × 227 (65 KByte)Capmoreduced to 16 colors with no quality loss
08:31, 2 gen 2008Miniadura de la version di 08:31, 2 gen 2008225 × 227 (148 KByte)Oleg Alexandrov{{Information |Description=Illustration of wavefronts in the context of Snell's law. |Source=self-made with MATLAB |Date=05:36, 1 January 2008 (UTC) |Author= Oleg Alexandrov |Permission= |oth

Quell fail chì l'è doprad de la pagina chichinscì:

Utilizazzion global di fail

Anca questi Wiki chì a dopren quell fail chì:

Varda utilizazzion global de quell fail chì.