Archivi:Discontinuity jump.eps.png
Grandezza de questa pagina de veduda antecipada: 643 × 599 picsel. Alter risoluzzion: 258 × 240 picsel | 515 × 480 picsel | 824 × 768 picsel | 1 099 × 1 024 picsel | 2 122 × 1 978 picsel.
Fail orginal (2 122 × 1 978 picsel, dimension : 81 KByte, sort MIME: image/png)
Transferred from en.wikipedia to Commons by Maksim.
The original description page was here. All following user names refer to en.wikipedia.
Somari
Made by me with matlab. {PD.}
Licenza
| Mi, titolar del dirit d'autor per questa opera chì, la meti foeura in del domini publich. Questa norma chì la var in tut el mond. In d'un quai paes chesschì el podarìss vesser minga permetud de la lensg. In del cas: Mi sicuri a chissessia el dirit de drovà quell lavorà chì per qualsessia fin, sota nissuna condizzion, condamench ch'a ghe sìen di condizzion imposte de la lensg. |
Source code (MATLAB)
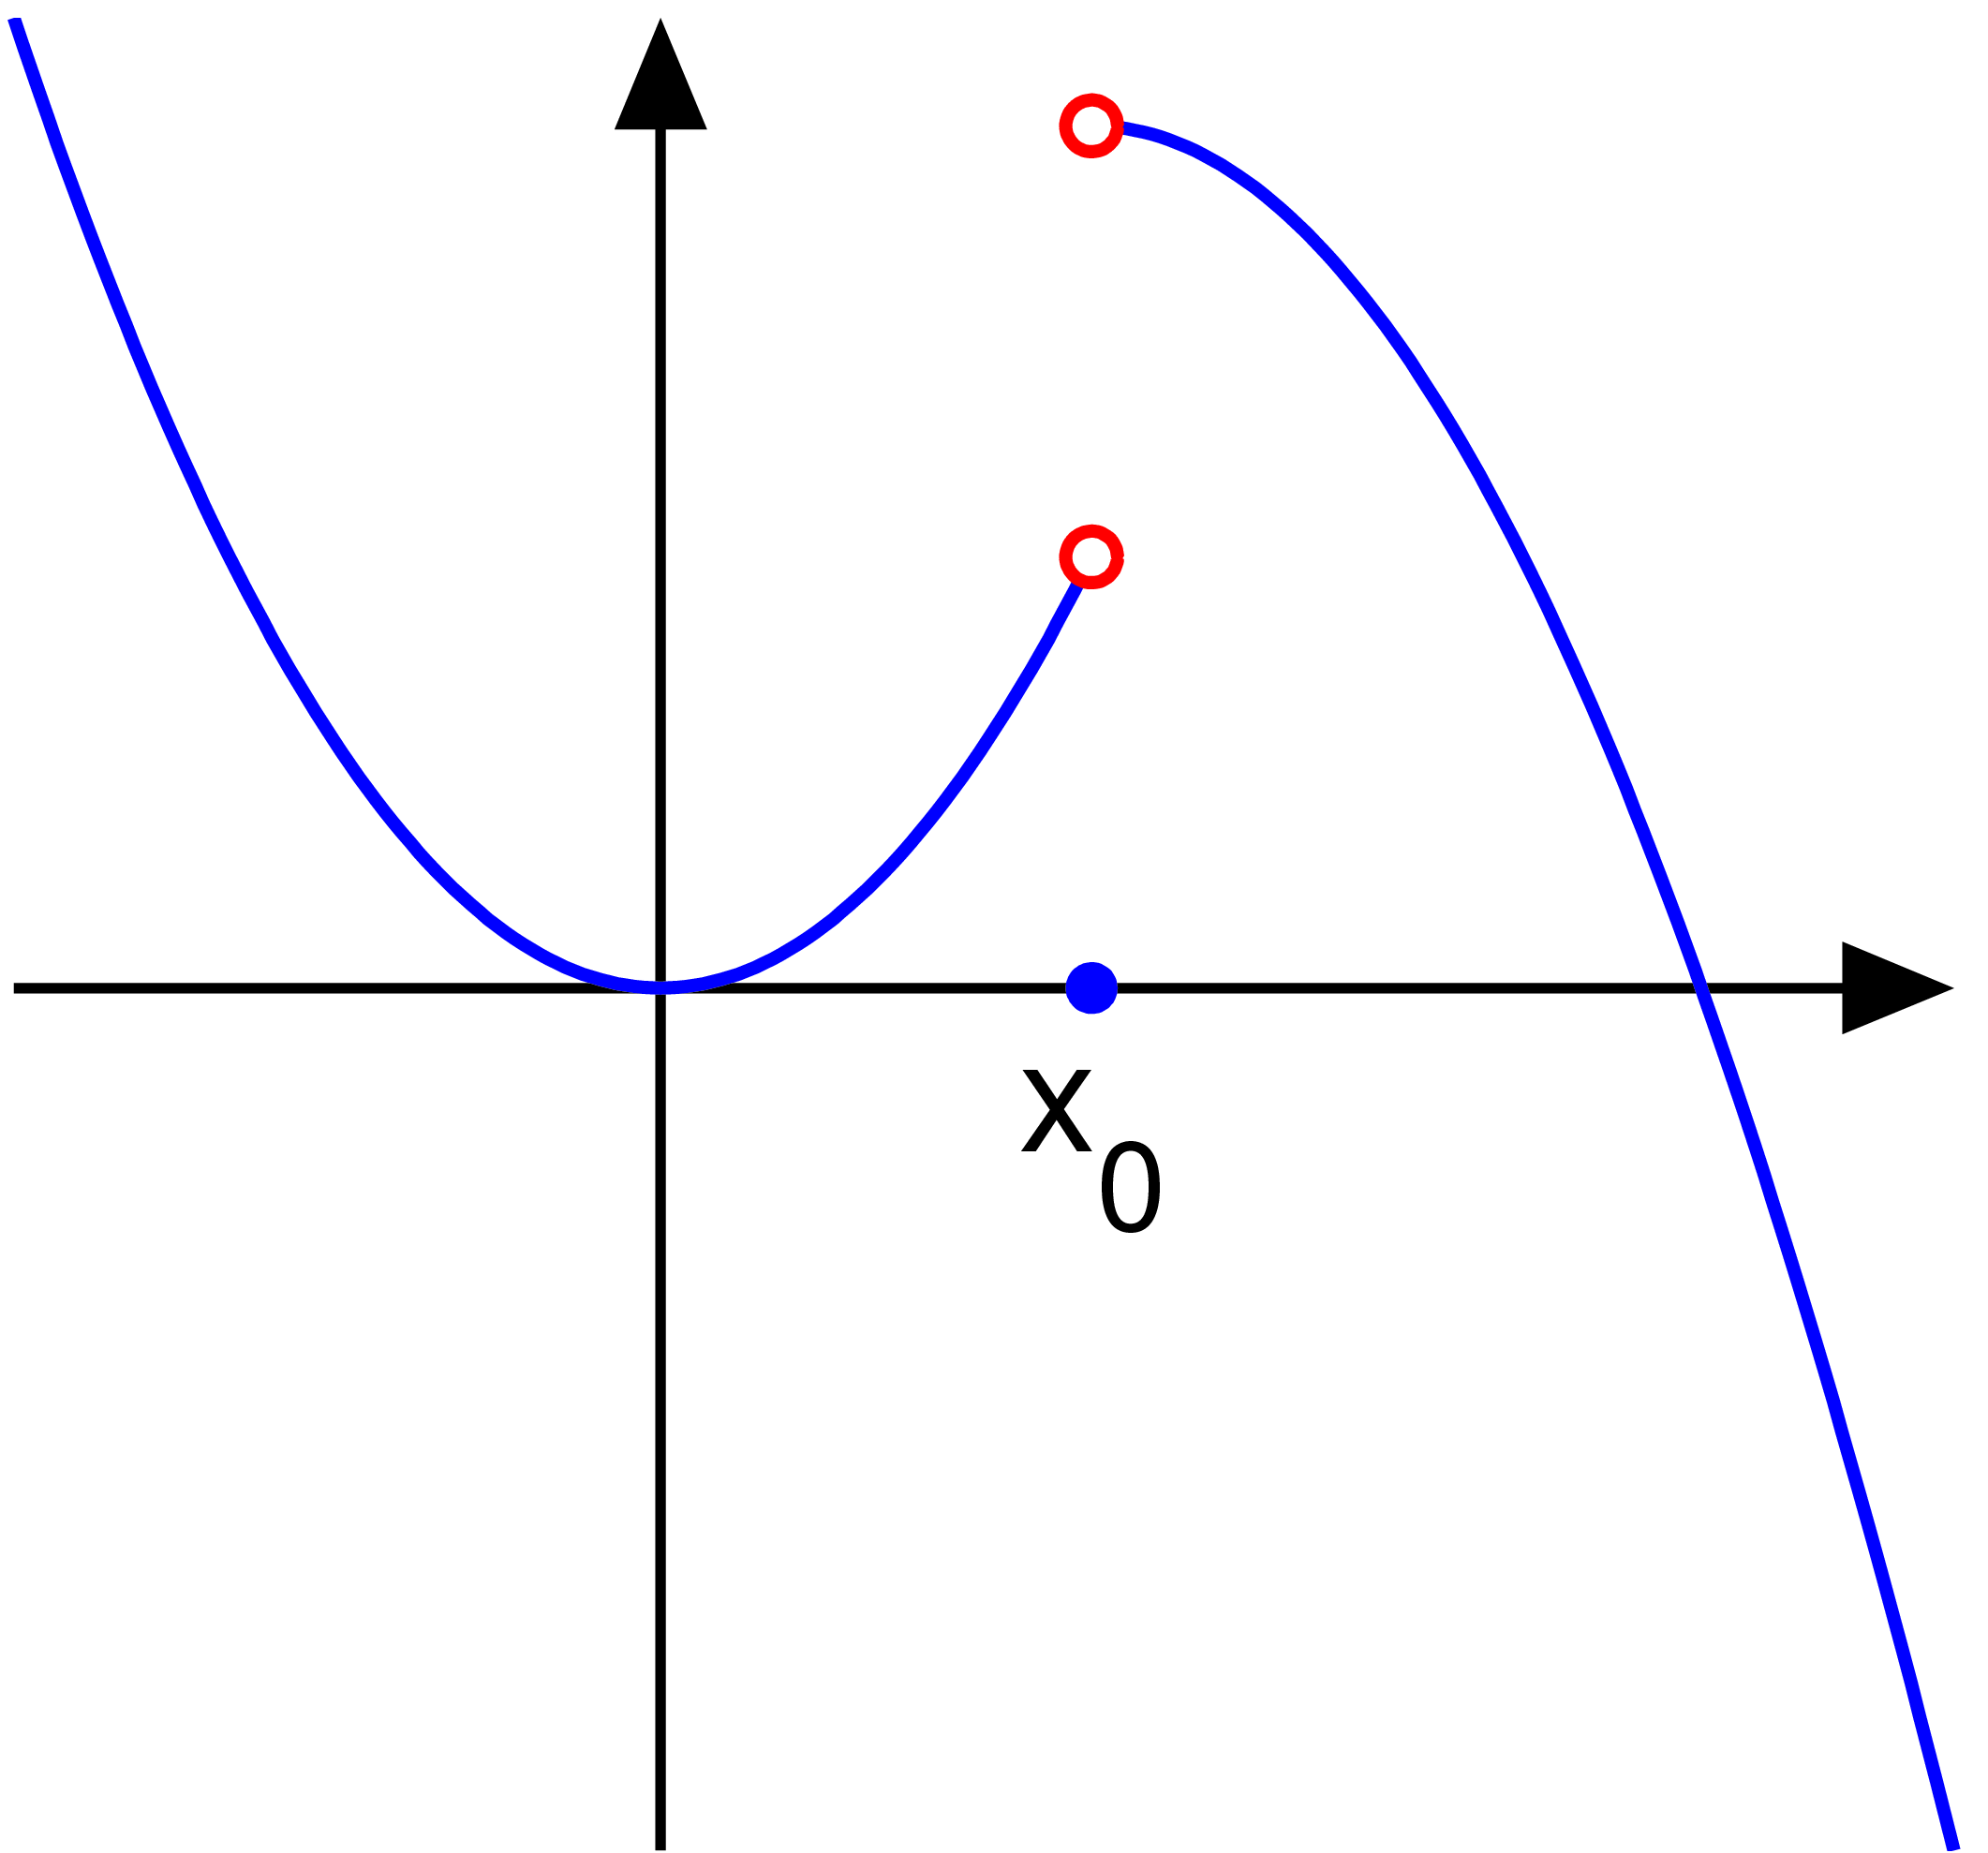
function discontinuity()

   % set up the plotting window
   thick_line=2.5; thin_line=2; arrow_size=14; arrow_type=2;
   fs=30; circrad=0.06;

% picture 1
   a=-1.5; b=3; h=0.02; x0=1;
   X1=a:h:x0; X2=x0:h:b; X=[X1 X2];
   Y1=X1.^2; Y2=Y1(length(Y1))+(-1)*(X2-X2(1)); Y=[Y1 Y2]; y01=Y1(length(Y1)); y02=Y2(1);

   figure(1); clf; hold on; axis equal; axis off;
   axes_points(a, b, thin_line, thick_line, arrow_size, arrow_type, x0, y01, y02, circrad, fs, X, Y, X1, Y1, X2, Y2)
   saveas(gcf, 'discontinuity_removable.eps', 'psc2')

% picture 2
   a=-1.5; b=3; h=0.02; x0=1;
   X1=a:h:x0; X2=x0:h:b; X=[X1 X2];
   Y1=X1.^2; Y2=2-(X2-x0).^2; Y=[Y1 Y2]; y01=Y1(length(Y1)); y02=Y2(1);

   figure(2); clf; hold on; axis equal; axis off;
   axes_points(a, b, thin_line, thick_line, arrow_size, arrow_type, x0, y01, y02, circrad, fs, X, Y, X1, Y1, X2, Y2)
   saveas(gcf, 'discontinuity_jump.eps', 'psc2')

% picture 3
   a=-1.5; b=3; h=0.001; x0=1;
   X1=a:h:x0; X2=x0:h:b; X=[X1 X2];
   Y1=sin(5./(X1-x0-eps)); Y2=0.1./(X2-x0+50*h); Y=[Y1 Y2]; y01=Y1(length(Y1)); y02=Y2(1);

   figure(3); clf; hold on; axis equal; axis off;
   axes_points2(a, b, thin_line, thick_line, arrow_size, arrow_type, x0, NaN, NaN, circrad, fs, X, Y, X1, Y1, X2, Y2)
   saveas(gcf, 'discontinuity_essential.eps', 'psc2')

disp('Converting to png...')
! convert -density 400 -antialias discontinuity_removable.eps discontinuity_removable.png
! convert -density 400 -antialias discontinuity_jump.eps discontinuity_jump.png
! convert -density 400 -antialias discontinuity_essential.eps discontinuity_essential.png

function axes_points(a, b, thin_line, thick_line, arrow_size, arrow_type, x0, y01, y02, circrad, fs, X, Y, X1, Y1, X2, Y2)
   arrow([a 0], [b, 0], thin_line, arrow_size, pi/8,arrow_type, [0, 0, 0]) % xaxis
   small=0.2; arrow([0, min(Y)], [0, max(Y)], thin_line, arrow_size, pi/8,arrow_type, [0, 0, 0]); % y axis

   plot(X1, Y1, 'linewidth', thick_line); plot(X2, Y2, 'linewidth', thick_line)

   ball(x0, 0, circrad, [0 0 1 ]);
   ball_empty(x0, y01, thick_line, circrad, [1 0 0 ]); ball_empty(x0, y02, thick_line, circrad, [1 0 0 ]);
   H=text(x0, -0.006*fs,  'x_0'); set(H, 'fontsize', fs, 'HorizontalAlignment', 'c', 'VerticalAlignment', 'c')

function axes_points2(a, b, thin_line, thick_line, arrow_size, arrow_type, x0, y01, y02, circrad, fs, X, Y, X1, Y1, X2, Y2)
   arrow([a 0], [b, 0], thin_line, arrow_size, pi/8,arrow_type, [0, 0, 0]) % xaxis
   small=0.2; arrow([0, min(Y)], [0, max(Y)], thin_line, arrow_size, pi/8,arrow_type, [0, 0, 0]); % y axis

   plot(X1, Y1, 'linewidth', thick_line); plot(X2, Y2, 'linewidth', thick_line)

   ball(x0, 0, circrad, [0 0 1 ]);
   ball_empty(x0, y01, thick_line, circrad, [1 0 0 ]); ball_empty(x0, y02, thick_line, circrad, [1 0 0 ]);
   H=text(x0+0.2, -0.006*fs,  'x_0'); set(H, 'fontsize', fs, 'HorizontalAlignment', 'c', 'VerticalAlignment', 'c')

function ball(x, y, r, color)
   Theta=0:0.1:2*pi;
   X=r*cos(Theta)+x;
   Y=r*sin(Theta)+y;
   H=fill(X, Y, color);
   set(H, 'EdgeColor', 'none');

function ball_empty(x, y, thick_line, r, color)
   Theta=0:0.1:2*pi;
   X=r*cos(Theta)+x;
   Y=r*sin(Theta)+y;
   H=fill(X, Y, [1 1 1]);
   %set(H, 'EdgeColor', color);
  plot(X, Y, 'color', color, 'linewidth', thick_line);

function arrow(start, stop, thickness, arrowsize, sharpness, arrow_type, color)

%  draw a line with an arrow at the end
%  start is the x,y point where the line starts
%  stop is the x,y point where the line stops
%  thickness is an optional parameter giving the thickness of the lines
%  arrowsize is an optional argument that will give the size of the arrow
%  It is assumed that the axis limits are already set
%  0 < sharpness < pi/4 determines how sharp to make the arrow
%  arrow_type draws the arrow in different styles. Values are 0, 1, 2, 3.

%       8/4/93    Jeffery Faneuff
%       Copyright (c) 1988-93 by the MathWorks, Inc.
%       Modified by Oleg Alexandrov 2/16/03

   if nargin <=6
      color=[0, 0, 0];
   end

   if (nargin <=5)
      arrow_type=0;   % the default arrow, it looks like this: ->
   end

   if (nargin <=4)
      sharpness=pi/4; % the arrow sharpness - default = pi/4
   end

   if nargin<=3
      xl = get(gca,'xlim');
      yl = get(gca,'ylim');
      xd = xl(2)-xl(1);
      yd = yl(2)-yl(1);
      arrowsize = (xd + yd) / 2;   % this sets the default arrow size
   end

   if (nargin<=2)
      thickness=0.5; % default thickness
   end

   xdif = stop(1) - start(1);
   ydif = stop(2) - start(2);

   if (xdif == 0)
      if (ydif >0)
         theta=pi/2;
      else
         theta=-pi/2;
      end
   else
      theta = atan(ydif/xdif);  % the angle has to point according to the slope
   end

   if(xdif>=0)
      arrowsize = -arrowsize;
   end

   if (arrow_type == 0) % draw the arrow like two sticks originating from its vertex
      xx = [start(1), stop(1),(stop(1)+0.02*arrowsize*cos(theta+sharpness)),NaN,stop(1),...
            (stop(1)+0.02*arrowsize*cos(theta-sharpness))];
      yy = [start(2), stop(2), (stop(2)+0.02*arrowsize*sin(theta+sharpness)),NaN,stop(2),...
            (stop(2)+0.02*arrowsize*sin(theta-sharpness))];
      plot(xx,yy, 'LineWidth', thickness, 'color', color)
   end

   if (arrow_type == 1)  % draw the arrow like an empty triangle
      xx = [stop(1),(stop(1)+0.02*arrowsize*cos(theta+sharpness)), ...
            stop(1)+0.02*arrowsize*cos(theta-sharpness)];
      xx=[xx xx(1) xx(2)];

      yy = [stop(2),(stop(2)+0.02*arrowsize*sin(theta+sharpness)), ...
            stop(2)+0.02*arrowsize*sin(theta-sharpness)];
      yy=[yy yy(1) yy(2)];

      plot(xx,yy, 'LineWidth', thickness, 'color', color)

%     plot the arrow stick
      plot([start(1) stop(1)+0.02*arrowsize*cos(theta)*cos(sharpness)], [start(2), stop(2)+ ...
                    0.02*arrowsize*sin(theta)*cos(sharpness)], 'LineWidth', thickness, 'color', color)

   end

   if (arrow_type==2) % draw the arrow like a full triangle
      xx = [stop(1),(stop(1)+0.02*arrowsize*cos(theta+sharpness)), ...
            stop(1)+0.02*arrowsize*cos(theta-sharpness),stop(1)];

      yy = [stop(2),(stop(2)+0.02*arrowsize*sin(theta+sharpness)), ...
            stop(2)+0.02*arrowsize*sin(theta-sharpness),stop(2)];
      H=fill(xx, yy, color);% fill with black
      set(H, 'EdgeColor', 'none')

%     plot the arrow stick
      plot([start(1) stop(1)+0.01*arrowsize*cos(theta)], [start(2), stop(2)+ ...
                    0.01*arrowsize*sin(theta)], 'LineWidth', thickness, 'color', color)
   end

   if (arrow_type==3) % draw the arrow like a filled 'curvilinear' triangle
      curvature=0.5; % change here to make the curved part more curved (or less curved)
      radius=0.02*arrowsize*max(curvature, tan(sharpness));
      x1=stop(1)+0.02*arrowsize*cos(theta+sharpness);
      y1=stop(2)+0.02*arrowsize*sin(theta+sharpness);
      x2=stop(1)+0.02*arrowsize*cos(theta)*cos(sharpness);
      y2=stop(2)+0.02*arrowsize*sin(theta)*cos(sharpness);
      d1=sqrt((x1-x2)^2+(y1-y2)^2);
      d2=sqrt(radius^2-d1^2);
      d3=sqrt((stop(1)-x2)^2+(stop(2)-y2)^2);
      center(1)=stop(1)+(d2+d3)*cos(theta);
      center(2)=stop(2)+(d2+d3)*sin(theta);

      alpha=atan(d1/d2);
      Alpha=-alpha:0.05:alpha;
      xx=center(1)-radius*cos(Alpha+theta);
      yy=center(2)-radius*sin(Alpha+theta);
      xx=[xx stop(1) xx(1)];
      yy=[yy stop(2) yy(1)];

      H=fill(xx, yy, color);% fill with black
      set(H, 'EdgeColor', 'none')

%     plot the arrow stick
      plot([start(1) center(1)-radius*cos(theta)], [start(2), center(2)- ...
                    radius*sin(theta)], 'LineWidth', thickness, 'color', color);
   end
| date/time | username | edit summary |
|---|---|---|
| 04:49, 5 December 2005 | en:User:Oleg Alexandrov | (clean up code) |
| 00:01, 22 November 2005 | en:User:Oleg Alexandrov | (+ source code) |
| 00:52, 12 September 2005 | en:User:Oleg Alexandrov | (Made by me with matlab. {PD.}) |
Register original del caregament
Legend: (cur) = this is the current file, (del) = delete this old version, (rev) = revert to this old version.
Click on date to download the file or see the image uploaded on that date.
- (del) (cur) 10:30, 20 January 2006 . . DavidHouse ( en:User_talk:DavidHouse Talk) . . 318x297 (10408 bytes) (Reverted to earlier revision)
- (del) (rev) 10:30, 20 January 2006 . . DavidHouse ( en:User_talk:DavidHouse Talk) . . 317x297 (8531 bytes) (Reverted to earlier revision)
- (del) (rev) 01:28, 12 September 2005 . . en:User:Oleg_Alexandrov Oleg Alexandrov ( en:User_talk:Oleg_Alexandrov Talk) . . 318x297 (10408 bytes)
- (del) (rev) 00:52, 12 September 2005 . . en:User:Oleg_Alexandrov Oleg Alexandrov ( en:User_talk:Oleg_Alexandrov Talk) . . 317x297 (8531 bytes) (Made by me with matlab. { PD. })
derivative works
Derivative works of this file: Not defined at x0.svg

|
Questa immagine (categorizzazione automatica: math) o tutte le immagini in questa categoria o galleria dovrebbero essere ricreate usando grafica vettoriale come file SVG. Questo offre diversi vantaggi: vedi Commons:Media for cleanup per maggiori informazioni. Se è disponibile una versione in formato SVG di questa immagine, per favore caricala. Dopo aver caricato un file SVG, sostituisci questo avviso con il template {{Vector version available|nome_immagine.svg}}.
|
Cronologia de l'archivi
Schiscia in su un grup data/ora per vedè l'archivi com 'a l'è che l'era in quell moment là
| Data/Ora | Miniadura | Grandezza | Utent | Coment | |
|---|---|---|---|---|---|
| corent | 06:17, 11 Lui 2013 | | 2 122 × 1 978 (81 KByte) | Oleg Alexandrov | Made the point on the axis blue, per request, this is how it should be. |
| 20:09, 18 Mrz 2006 |  | 318 × 297 (10 KByte) | Maksim | La bildo estas kopiita de wikipedia:en. La originala priskribo estas: == Summary == Made by me with matlab. {PD.} == Licensing == {{PD-self}} ==Source code (Matlab) == <pre> <nowiki> function discontinuity() % graph a function which has discontin |
Ligámm
Quell fail chì l'è doprad de la pagina chichinscì:
Utilizazzion global di fail
Anca questi Wiki chì a dopren quell fail chì:
- Doperad in beta.wikiversity.org
- Doperad in de.wikipedia.org
- Doperad in en.wikipedia.org
- Doperad in en.wikibooks.org
- Doperad in eo.wikipedia.org
- Doperad in es.wikipedia.org
- Doperad in fa.wikipedia.org
- Doperad in fr.wikipedia.org
- Doperad in he.wikipedia.org
- Doperad in it.wikipedia.org
- Doperad in ja.wikipedia.org
- Doperad in ko.wikipedia.org
- Doperad in nl.wikipedia.org
- Doperad in no.wikipedia.org
- Doperad in ru.wikipedia.org
- Doperad in sv.wikipedia.org
- Doperad in tl.wikipedia.org
- Doperad in www.wikidata.org
- Doperad in zh.wikipedia.org